
Understanding Moving Averages
Moving averages are one of the most popular tools used in technical analysis. Traders use them to identify trends, understand market direction, and reduce the noise created by short-term price fluctuations.
One reason moving averages are so widely used is because they simplify charts and make trends easier to follow. Instead of reacting to every small movement in the market, traders can focus on the broader direction of price action.
Because of their simplicity and effectiveness, moving averages are commonly used by both beginner and professional traders across forex, stocks, cryptocurrencies, and commodities.
What Is a Moving Average?
A moving average is a technical indicator that calculates the average price of an asset over a specific period of time.
Its main purpose is to smooth out price action and help traders identify whether the market is trending upward, downward, or moving sideways.
For example, a 50-day moving average calculates the average closing price over the last 50 days. As new prices appear, the average continuously updates, which is why it is called a “moving” average.
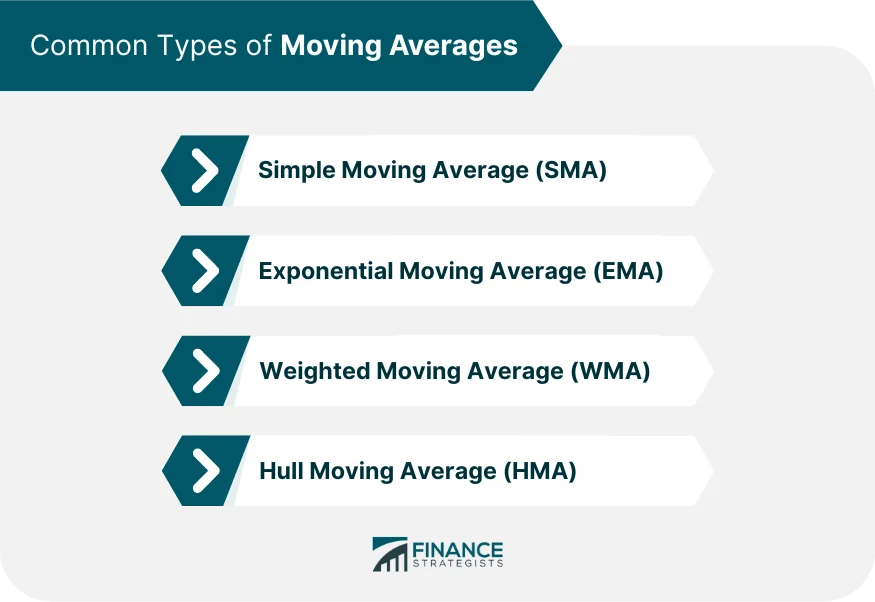
Types of Moving Averages
There are different types of moving averages, but the two most common are the Simple Moving Average (SMA) and the Exponential Moving Average (EMA).
The SMA gives equal importance to every price within the selected period. Because of this, it reacts more slowly to sudden market movements and produces smoother signals.
The EMA, on the other hand, gives more weight to recent prices, making it faster and more responsive to current market conditions. Many short-term traders prefer EMAs because they react more quickly during fast-moving markets.
How Traders Use Moving Averages
One of the main uses of moving averages is identifying trends.
When price stays above a moving average, traders often consider the market bullish. When price remains below the moving average, the market may be viewed as bearish.
This helps traders avoid trading against the dominant trend and provides a clearer picture of overall market direction.
Moving averages are also commonly used as dynamic support and resistance levels. In strong uptrends, price may repeatedly bounce from important moving averages before continuing higher. In downtrends, moving averages can act as resistance where price struggles to break upward.
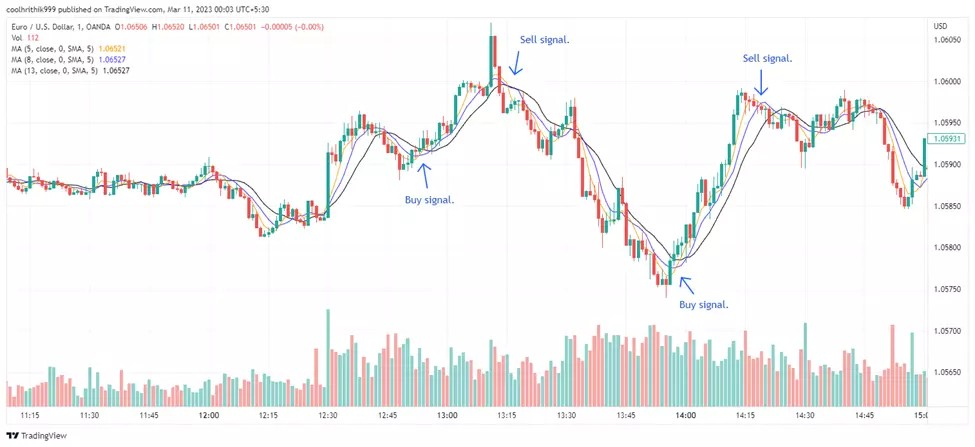
The Moving Average Crossover Strategy
One of the most popular beginner strategies involving moving averages is the crossover strategy.
This approach uses two moving averages with different time periods. Traders watch for moments when the shorter-term moving average crosses above or below the longer-term moving average.
A bullish crossover happens when the shorter-term moving average crosses above the longer-term average, which may suggest strengthening momentum and the beginning of an uptrend.
A bearish crossover occurs when the shorter-term average crosses below the longer-term average, potentially signaling weakening momentum or a downtrend.
Many traders use combinations such as the 50 EMA and 200 EMA to identify longer-term market direction.
Best Time Frames for Moving Averages
Moving averages can be used on almost any chart time frame.
Short-term traders often focus on faster averages such as the 9 EMA or 20 EMA because they respond quickly to price action.
Swing traders and long-term traders usually prefer slower moving averages like the 50 SMA, 100 SMA, or 200 SMA because they provide smoother signals and help identify larger trends.
Longer-period moving averages tend to reduce market noise but also react more slowly to changes in direction.
Advantages of Moving Average Strategies
One of the biggest advantages of moving averages is their simplicity. They are easy to understand and beginner-friendly, making them a great starting point for traders learning technical analysis.
Moving averages also help traders stay aligned with the market trend instead of reacting emotionally to short-term fluctuations.
Another benefit is versatility. Moving averages can be applied to many different markets and trading styles, from day trading to long-term investing.
The Limitations of Moving Averages
Although moving averages are very useful, they are not perfect.
One important limitation is that they are lagging indicators, meaning they are based on past prices. Because of this, signals may appear after a large part of the move has already happened.
Moving averages can also produce false signals in sideways or ranging markets where price constantly crosses back and forth over the indicator.
This is why moving averages tend to work best in clear trending conditions.
Combining Moving Averages with Other Tools
Many traders combine moving averages with additional indicators to improve analysis and reduce false signals.
Popular combinations include RSI, MACD, volume analysis, support and resistance, and candlestick patterns.
For example, RSI is often used to measure momentum alongside moving averages.
RSI=100−1+RS100
Using multiple confirmations can help traders make more informed decisions instead of relying on a single indicator alone.
Final Thoughts
Moving average strategies are among the most widely used methods for identifying trends and understanding market direction. Their simplicity makes them especially useful for beginners, while their flexibility keeps them valuable for experienced traders as well.
Although moving averages cannot predict the future perfectly, they can become powerful tools when combined with proper risk management and market analysis.
The key is not blindly following every signal, but learning how moving averages fit into overall market structure and trading psychology.