
Understanding Breakout Trading
Breakout trading is one of the most popular strategies used in financial markets. The main idea is simple: traders look for moments when price breaks through important support or resistance levels with strong momentum.
These breakouts can lead to powerful market movements because they often signal a major shift between buyers and sellers. When price escapes an important level, volatility and trading activity usually increase, creating opportunities for traders to capture larger moves.
Although breakout trading may look easy at first, successful breakout traders rely heavily on patience, timing, and proper risk management.
What Is a Breakout?
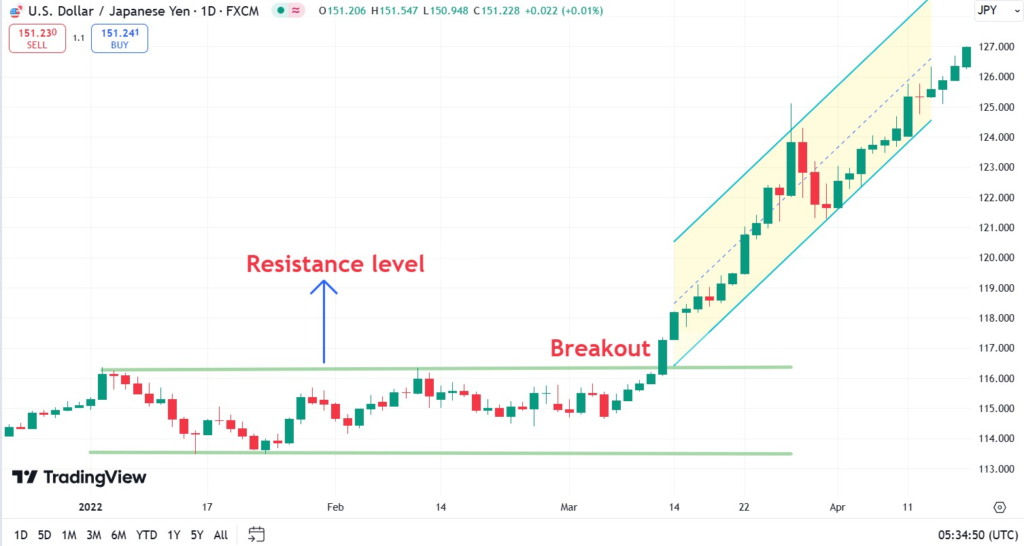
A breakout happens when price moves beyond a key support or resistance zone that the market previously struggled to cross.
A bullish breakout occurs when price breaks above resistance, which may suggest increasing buying pressure and the possible beginning of an uptrend.
A bearish breakout happens when price falls below support, potentially signaling stronger selling pressure and the start of a downtrend.
Breakouts can happen in almost every market, including forex, stocks, cryptocurrencies, commodities, and indices.
Why Breakouts Happen
Markets often spend time moving sideways or consolidating before a breakout occurs. During this period, pressure builds between buyers and sellers.
For example, if buyers continue testing a resistance level while sellers become weaker, the market may eventually break upward with strong momentum. Once that resistance level breaks, more traders often enter the market, which can accelerate the move even further.
The same principle applies to bearish breakdowns below support levels.
The Importance of Volume
Volume plays a major role in breakout trading because it helps traders evaluate the strength of a move.
A breakout with strong volume is usually considered more reliable because it shows real market participation. On the other hand, breakouts with weak volume are often more likely to fail.
Many traders wait for volume confirmation before entering trades because it can help reduce the chances of getting trapped in false breakouts.
Common Breakout Patterns
Breakout traders often focus on chart patterns where price begins compressing before a strong move.
Triangle patterns are very popular because they show tightening price action and decreasing volatility before the breakout happens. Once price escapes the triangle, momentum often increases quickly.
Range breakouts are another common setup. This happens when the market trades between support and resistance for an extended period before finally breaking out of the range.
Flag patterns are also widely used in breakout trading. These patterns usually appear after strong trends and may indicate temporary consolidation before the trend continues.
Entering Breakout Trades
Some traders prefer aggressive entries and enter immediately when price breaks an important level. This approach can provide better entry prices and larger profit potential, but it also increases the risk of false breakouts.
Other traders prefer waiting for confirmation before entering. They may look for a candle close beyond the level, stronger volume, or a retest of the breakout area before opening a position.
This slower approach can sometimes reduce risk, although it may also miss part of the move.
False Breakouts
One of the biggest challenges in breakout trading is dealing with false breakouts.
A false breakout occurs when price briefly moves beyond support or resistance but then quickly reverses back into the previous range. These moves often trap impatient traders who enter too early.
Because false breakouts are common, experienced traders usually combine breakout setups with confirmation signals and strict risk management.
Indicators Used in Breakout Trading
While price action is the foundation of breakout trading, some indicators can help traders improve analysis.
Many traders use moving averages, volume indicators, RSI, Bollinger Bands, or VWAP alongside support and resistance levels.
For example, Bollinger Bands are often used to measure volatility.
y=Upper Band−Lower Band
When volatility expands and the bands widen, it may signal that a stronger breakout move is developing.
RSI is also commonly used to confirm momentum strength during breakout setups.
RSI=100−1+RS100
However, traders should avoid overcomplicating charts with too many indicators at once.
Breakout Trading and Market Psychology
Breakouts are strongly connected to trader psychology.
When price breaks above resistance, many traders experience fear of missing out and rush into the market. This additional buying pressure can push price even higher.
When support levels fail, panic selling may appear, increasing bearish momentum.
Understanding these emotional reactions can help explain why breakout moves sometimes become very aggressive.
Is Breakout Trading Good for Beginners?
Breakout trading can be beginner-friendly because the core concept is relatively easy to understand. However, beginners should first learn important fundamentals such as support and resistance, market structure, and risk management.
Without discipline and proper planning, breakout trading can quickly become emotional and risky.
Patience is extremely important because not every breakout leads to a strong trend.
Final Thoughts
Breakout trading is a strategy focused on capturing strong market movements after price breaks important support or resistance levels.
When combined with volume confirmation, technical analysis, and proper risk management, breakout trading can provide opportunities across forex, stocks, cryptocurrencies, and many other markets.
Like any strategy, success does not come from winning every trade. The most successful breakout traders focus on discipline, consistency, and protecting their capital over the long term.