
Understanding Crypto Charts
If you are new to cryptocurrency trading, looking at a price chart for the first time can feel overwhelming. Candlesticks, trend lines, support levels, and indicators may seem confusing, leading many beginners to believe that successful traders rely on complicated analysis.
In reality, reading crypto charts is much simpler than it first appears. Most experienced traders focus on understanding price behavior, identifying trends, and recognizing key areas where buyers and sellers become active. Learning these fundamentals is often far more valuable than filling a chart with dozens of indicators.
Developing the ability to read charts takes time and practice, but it is one of the most important skills any crypto trader can build. Whether you are interested in short-term trading or long-term investing, understanding how price moves can help you make more informed decisions and avoid relying purely on emotion or social media opinions.
What Are Crypto Charts?
A crypto chart is a visual representation of how the price of a cryptocurrency changes over time. Every movement on the chart reflects buying and selling activity between market participants.
Instead of guessing where the market might move next, traders use charts to understand what has already happened and identify areas that could become important in the future.
Most cryptocurrency exchanges and charting platforms display live price charts, allowing traders to monitor the market in real time. While every chart looks different at first, they all present the same basic information: price and time.
The Most Common Types of Crypto Charts
Several chart types are available, but beginners only need to understand three of them.
Line Charts
A line chart connects the closing price of each period with a simple line. It provides a clean overview of the market and is useful for identifying long-term trends, although it offers limited detail about price movements.
Bar Charts
Bar charts display more information by showing the opening price, closing price, highest price, and lowest price for each period. While useful, they are less popular among beginner traders because they can be harder to read.
Candlestick Charts
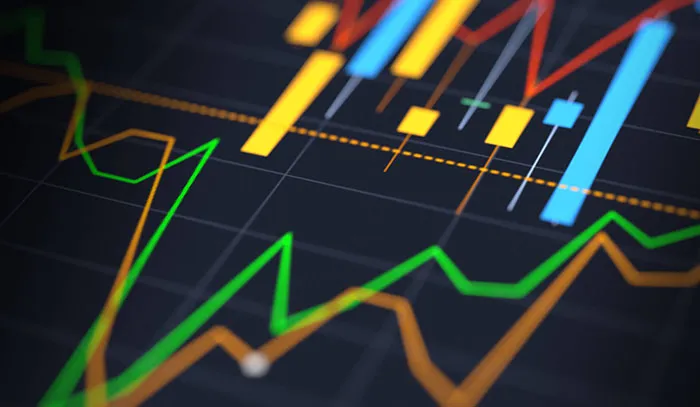
Candlestick charts are by far the most widely used in cryptocurrency trading.
Each candlestick shows four pieces of information:
- Opening price
- Closing price
- Highest price
- Lowest price
A green candle usually means the price closed higher than it opened, while a red candle means the opposite.
Because candlesticks clearly display market sentiment, they have become the standard chart type used by most traders around the world.
Why Candlesticks Matter
One of the first things I noticed while studying different trading strategies is that experienced traders rarely focus on individual candles alone. Instead, they look at how groups of candlesticks behave around important price levels.
For example, a long bullish candle after a period of selling pressure may indicate that buyers are starting to regain control. On the other hand, several small candles moving sideways often suggest that the market is waiting for new momentum before making its next move.
Rather than trying to memorize every candlestick pattern, beginners usually benefit much more from learning how candles behave within the overall market structure.
Reading Price Action
Price action simply refers to the way price moves over time.
Every movement on a chart is the result of buyers and sellers interacting with each other. When demand is stronger than supply, prices generally move higher. When selling pressure increases, prices tend to fall.
Instead of relying entirely on indicators, many traders prefer to study price action because it provides a direct view of market behavior.
Learning to recognize higher highs, lower lows, strong momentum, and periods of consolidation can help traders better understand what the market is doing before making a trading decision.
Support and Resistance
Support and resistance are among the first concepts every crypto trader should learn because they help explain where price is likely to react. Rather than moving randomly, financial markets often slow down, reverse, or accelerate around certain price levels where buyers and sellers become more active.
A support level is an area where buying pressure may prevent the price from falling further, while a resistance level is an area where selling pressure can slow or stop an upward movement. These levels are not exact prices but zones where market participants often make important decisions.
Many traders use support and resistance as part of their overall analysis instead of entering trades randomly. Waiting for the market to react around these key areas often provides much more information than simply chasing price movements.
Identifying Market Trends
Before opening any position, it is important to understand the overall direction of the market. One of the biggest mistakes beginners make is focusing only on individual candles without considering whether the broader trend is moving higher, lower, or sideways.
An uptrend is generally characterized by higher highs and higher lows, showing that buyers remain in control. A downtrend follows the opposite pattern, with lower highs and lower lows indicating stronger selling pressure. Sometimes the market moves within a relatively narrow range without establishing a clear direction. During these periods, traders often wait for stronger confirmation before entering new positions.
Understanding the trend does not guarantee successful trades, but it provides valuable context that can improve decision-making.
Why Trading Volume Matters
Price movements become much more meaningful when they are supported by trading volume. Volume represents the amount of a cryptocurrency that has been traded during a specific period and helps traders evaluate how much participation exists behind a move.
For example, if Bitcoin breaks above an important resistance level while trading volume increases significantly, many traders consider the breakout more reliable than a similar move occurring with very little market activity. Although volume should never be used on its own, it can provide useful confirmation when combined with price action and trend analysis.
Choosing the Right Timeframe
Crypto charts can be viewed across many different timeframes, from one-minute charts to monthly charts. The timeframe a trader chooses usually depends on their objectives and preferred trading style.
Short-term traders often analyze lower timeframes because they look for smaller price movements throughout the day. Swing traders generally focus on higher timeframes that allow them to capture larger trends over several days or weeks. Long-term investors usually rely on daily or weekly charts to understand the broader market direction rather than short-term fluctuations.
One habit that many beginners develop is constantly switching between timeframes searching for confirmation. In most cases, it is more effective to choose one primary timeframe while occasionally using a higher timeframe to understand the overall market structure.
Should You Use Indicators?
Technical indicators can be useful, but they work best as supporting tools rather than decision-makers. Many beginners believe that adding more indicators automatically improves their analysis, when in reality too much information often creates confusion.
Experienced traders usually start by understanding price action, support and resistance, and market structure before using indicators to confirm what they already see on the chart. Moving averages, RSI, MACD, and Bollinger Bands remain some of the most widely used tools, but none of them should be treated as a guarantee that the market will move in a particular direction.
Common Chart Patterns
As traders spend more time analyzing charts, they begin to recognize patterns that appear repeatedly across different cryptocurrencies and market conditions. Formations such as double tops, double bottoms, triangles, and flags reflect the ongoing battle between buyers and sellers and can sometimes provide clues about potential continuation or reversal movements.
However, chart patterns should always be viewed as probabilities rather than certainties. Even the strongest-looking setup can fail, which is why successful traders combine pattern recognition with risk management, patience, and a clear trading plan instead of relying on a single signal.
Common Mistakes Beginners Make
Learning to read crypto charts takes time, and most beginners make similar mistakes during the process. One of the most common is trying to predict every market movement instead of focusing on understanding what the chart is actually showing.
Another frequent mistake is relying too heavily on indicators while ignoring price action. Although indicators can be useful, they should support your analysis rather than replace it. Many traders fill their charts with so many tools that they end up making decisions based on conflicting signals instead of the market itself.
Patience is another challenge. Beginners often feel the need to open trades simply because they have spent time analyzing a chart. In reality, experienced traders understand that waiting for high-quality setups is often more valuable than trading constantly.
A Simple Example of Chart Analysis
Imagine that Bitcoin has been moving higher for several days, creating a clear uptrend. Eventually, the price pulls back toward a previous support level while trading volume begins to increase.
Instead of entering immediately, many traders wait to see whether buyers step back into the market. If the price reacts positively at support and continues following the overall trend, the setup may offer a higher-probability opportunity than buying after a large price increase.
This example shows why understanding market structure is often more useful than trying to predict every short-term movement. Reading a chart is not about knowing exactly what will happen next. It is about recognizing situations where the probability may be slightly more in your favor.
Practice Before Trading With Real Money
Like any other skill, chart reading improves with practice. The more time you spend observing how markets behave, the easier it becomes to recognize trends, important price levels, and recurring patterns.
Many beginners benefit from using demo accounts or simply reviewing historical charts before risking real money. This allows traders to develop confidence while learning how different market conditions affect price movements.
Over time, experience becomes one of the most valuable tools a trader can have. There is no shortcut that replaces regularly studying charts and reviewing previous market behavior.
Frequently Asked Questions
Do I need technical indicators to read crypto charts?
No. Many traders begin by learning price action, support and resistance, and trend analysis before using indicators as additional confirmation.
Which timeframe is best for beginners?
There is no perfect timeframe. Many beginners find the 1-hour or 4-hour charts easier to analyze because they contain less market noise than very short-term charts.
Can chart analysis predict the future?
No. Chart analysis helps traders identify probabilities based on historical price behavior, but no method can predict market movements with complete certainty.
How long does it take to learn chart reading?
The basics can be learned relatively quickly, but developing confidence and consistency usually requires regular practice and experience.
Final Thoughts
Reading crypto charts is one of the most valuable skills a trader can develop. While the charts may appear complicated at first, most successful traders rely on a solid understanding of trends, support and resistance, price action, and risk management rather than searching for perfect predictions.
The goal is not to forecast every market movement correctly. Instead, it is to build a structured approach that helps you make more informed decisions while managing risk effectively.
As with every aspect of trading, consistency matters more than speed. The more time you spend studying how markets behave, the more confident you will become when analyzing new opportunities and developing your own trading style.
Great content! Keep up the good work!