
Understanding Trading Indicators
Trading indicators are tools that help traders analyze financial markets and make more informed decisions. For beginners, indicators can make charts easier to understand by helping identify trends, momentum, volatility, and possible entry or exit points.
One of the biggest mistakes new traders make is adding too many indicators to their charts at once. This usually creates confusion and conflicting signals instead of improving results. In reality, successful trading is often about understanding a few simple tools properly and using them consistently.
Most trading platforms, including TradingView and MetaTrader 5, already include many popular indicators for free.
Moving Averages
Moving averages are considered one of the easiest indicators for beginners to understand. They calculate the average price of an asset over a specific period of time, helping smooth out short-term price fluctuations and making trends easier to spot.
There are two main types traders commonly use: the Simple Moving Average (SMA) and the Exponential Moving Average (EMA). The EMA reacts faster to recent price movements, while the SMA moves more smoothly.
Many traders use moving averages to identify the overall direction of the market. When price stays above the moving average, the trend is often considered bullish. When price trades below it, the market may be bearish. Because of their simplicity, moving averages are very popular in trend-following strategies.
RSI Indicator
The Relative Strength Index, usually called RSI, is another very popular indicator among beginners.
RSI=100−1+RS100
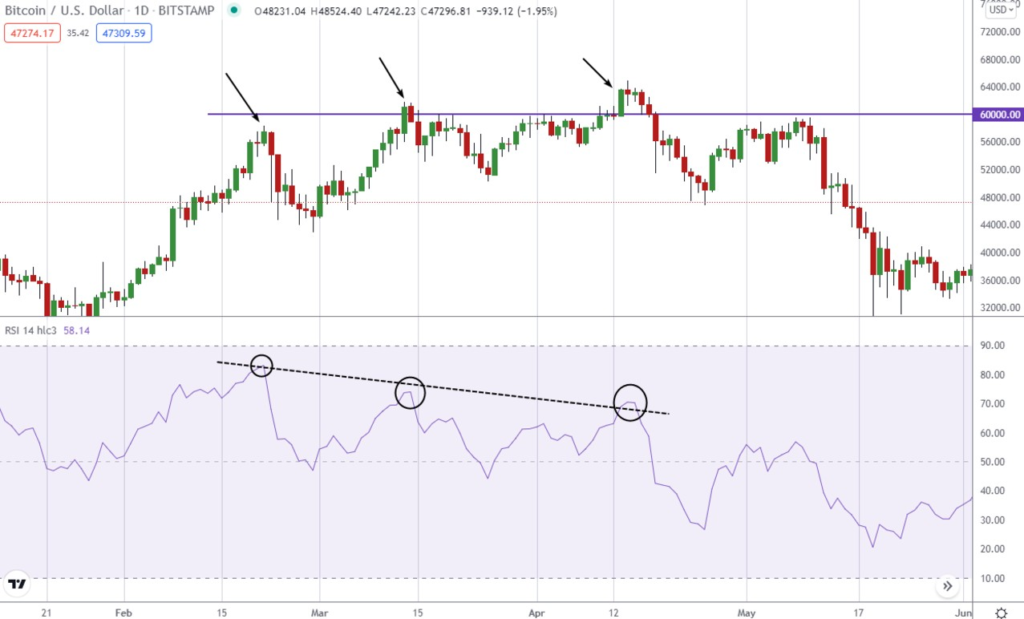
The RSI measures momentum and moves on a scale from 0 to 100. Traders often use it to identify overbought or oversold conditions in the market.
Generally, an RSI above 70 may suggest that an asset is overbought, while an RSI below 30 may indicate oversold conditions. This can help traders spot potential reversals or moments where price momentum is weakening.
However, beginners should remember that markets can stay overbought or oversold for long periods during strong trends. Because of this, RSI works best when combined with other forms of analysis instead of being used alone.
MACD Indicator
The MACD, which stands for Moving Average Convergence Divergence, is a trend and momentum indicator widely used by traders.
Although it may look more complicated at first, the MACD helps traders identify changes in momentum and possible shifts in market direction. Many traders pay attention to bullish or bearish crossovers between the MACD line and the signal line, as these can sometimes indicate potential trading opportunities.
The MACD is popular because it combines trend analysis with momentum analysis, giving traders a broader view of market behavior.
Bollinger Bands
Bollinger Bands are mainly used to measure volatility in the market. The indicator consists of a middle moving average with upper and lower bands surrounding price action.
When the bands widen, volatility is increasing. When the bands tighten, volatility is decreasing. Traders often use Bollinger Bands to identify possible breakout opportunities or periods where the market may be preparing for a larger move.
Beginners sometimes assume that touching the upper or lower band automatically means price will reverse, but this is not always true. Strong trends can keep prices near the bands for extended periods.
Why Volume Matters
Volume is another important tool that many traders use alongside indicators. It measures how much of an asset is being traded during a certain period of time.
High volume often suggests stronger market participation and can help confirm whether a trend or breakout has momentum behind it. Low volume may indicate uncertainty or weak market interest.
Even though volume is simple, it can provide valuable context when analyzing price movements.
Support and Resistance
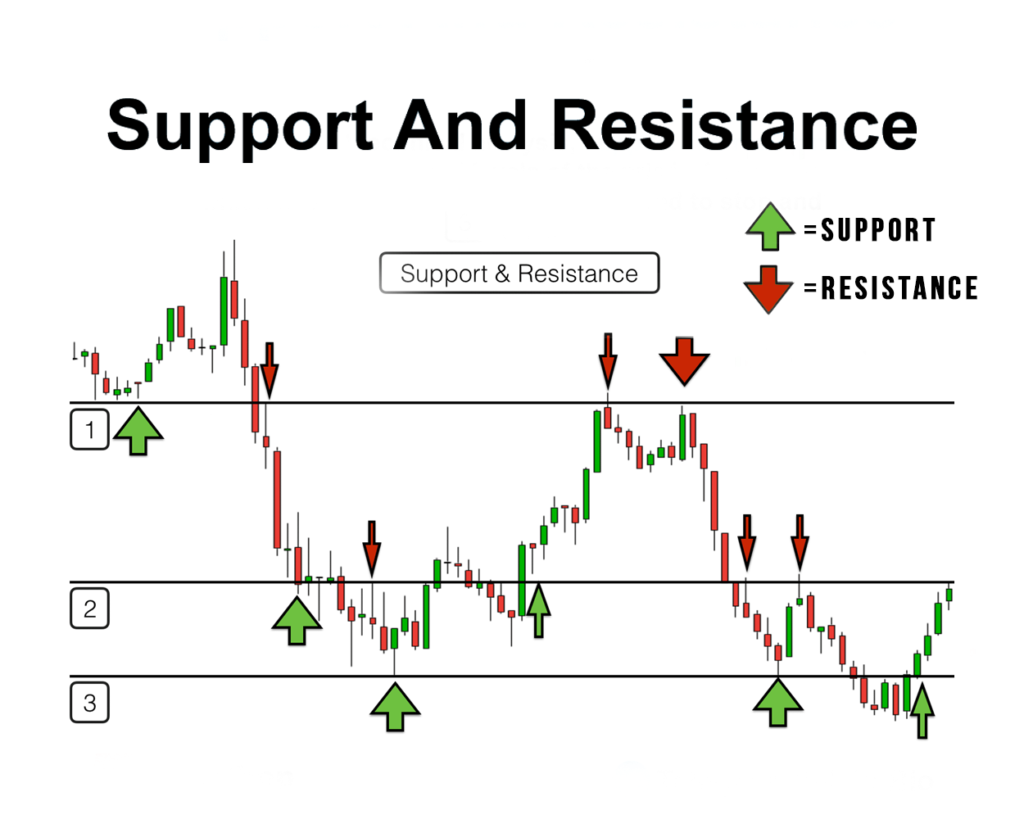
Support and resistance are not traditional indicators, but they are essential concepts for every trader.
Support refers to areas where buyers may enter the market and slow down falling prices. Resistance refers to levels where selling pressure may appear and prevent prices from rising further.
Many traders combine support and resistance with indicators like RSI or moving averages to improve their analysis and identify higher-probability setups.
Avoid Overcomplicating Your Charts
One of the most common beginner mistakes is trying to use too many indicators at the same time. More indicators do not automatically lead to better trading decisions.
In fact, simple charts are often more effective. Many experienced traders mainly rely on a few tools they understand deeply instead of constantly switching between complicated systems.
Indicators should support your analysis, not replace proper education, discipline, and risk management.
Final Thoughts
Trading indicators can be very useful for beginners because they help simplify chart analysis and improve understanding of market behavior. Tools like moving averages, RSI, MACD, and Bollinger Bands are popular because they are relatively easy to learn and widely used across different markets.
The key is not finding a “perfect indicator,” but learning how to use a few tools consistently and combining them with good risk management and patience.
Over time, traders develop their own preferences and learn which indicators work best for their trading style and goals.